
The object of this paper is to compare and analyse the road safety and traffic behaviour of road users in selected countries- Estonia (EST), Finland (FIN), Czech Republic (CZE), Hungary (HUN), United States of America (USA) and the Russian Federation (RUS) during thelast period. The main road safety and economic indices of selected countries are based on official statistics /1/ and presented in table
1. Table 1 Main Road Safety and Economic Indicators in Selected Countries, 1999
|
Index |
EST |
FIN |
CZE |
HUN |
USA |
RUS |
|
Population, 1000 |
1439 |
5171 |
10278 |
10043 |
272691 |
145559 |
|
Motor vehicles, 1000 |
546 |
2403 |
4279 |
2619 |
216309 |
23560 |
|
Motor vehicles per 1000 pop. |
379 |
465 |
416 |
261 |
793 |
162 |
|
Cars per 1000 pop. |
319 |
403 |
360 |
225 |
497 |
129 |
|
Motor veh.performance, mill.km |
6377 |
46010 |
40300 |
26934 |
4330358 |
260000 |
|
Fatalities (F) |
232 |
431 |
1455 |
1306 |
41611 |
29718 |
|
F per 1 million of population |
1.61 |
0.83 |
1.42 |
1.30 |
1.53 |
2.04 |
|
F per 10,000 motor vehicles |
4.25 |
1.79 |
3.40 |
4.99 |
1.92 |
12.6 |
|
F per 100 million veh.km |
3.64 |
0.94 |
3.61 |
4.85 |
0.96 |
11.4 |
After 1991, the motorization ratio (Figure 1) has been raised rapidly in all selected post-socialist countries. The increase of motorization level in the period 1991-1999 was 74% in Estonia, 46% in Czech Republic, 13% in Hun-gary and even 91% in Russian Federation, when it was 5% in Finland and 7.5% in USA (Figure 1).
The differences in road safety situation between the selected countries are moderate (2.5 times) in population-based fatality rate, but high (7 times) in vehicle related fatality rate and very high (12.5 times) in travel related fatality rate.
All countries have a visible progress in road safety. During the last decade (1990…1999) the number of fatalities per 10,000 motor vehicles have been reduced from 13.8 to 4.2 in Estonia, 2.9 to 1.7 in Finland, 4.5 to 3.4 in Czech Republic, 11.0 to 5.0 in Hungary, 2.4 to 1.9 in the USA and 29.3 to 12.6 in Russian Federation.
Even in high developed countries the safety level has been worse than today, as the safety improvement takes place during certain period, in parallel with motorization development. There are calculated safety levels for selected countries in the following, based on fatality rate per 10,000motor .
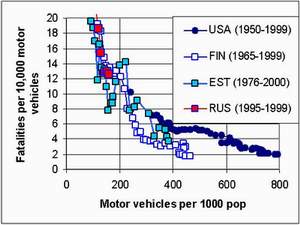
Figure 1. Vehicle Based Fatality Rate Development in Selected Countries
Figure 1 shows the decrease of vehicle fleet based fatality rate (F/V) by increase of the motorization.
We can conclude that:
Estonian and Finnish developments have similar trends during the period of motorization change from 50 to 200 vehicles per 1000 inhabitants;
When the motorization level in the USA was 200 to 465, the safety level was much worse than in Finland and comparable to that in Estonia;
Russian Federations F/V ratio is a little worse than in Estonia during the same motorization.
To determine the rate of decrease of F/V ratio the correlation models have been calculated as follows: F/V= a * Mb
Where M is motorization level (motor vehicles per 1000 of population)
F/V is the number of fatalities per 10,000 motor vehicles, a, b are constants
Table 2. Regression Results
|
Country |
a |
b |
R2 |
|
USA |
22,798 |
-1.38 |
0.91 |
|
Finland |
106,418 |
-1,76 |
0,94 |
|
Estonia |
1,394 |
-0,95 |
0,79 |
A country can improve its safety level in many ways:
Drivers might learn how to drive safer;
Road users can voluntarily use available active and passive safety devices;
Using carefully planned and enforced speed limits and other limitations, influencing safety behaviour;
Developing the punishment systems, e.g. increasing penalties for drinking and driving;
Using the best knowledge of safer road engineering measures, as well as developing the medical care and law enforcement methods;
Using more finances on road renovation and black spot elimination, etc.
The introduction of all the measures takes time and money, thus one country cannot jump over this stage quickly. When more developed country, then higher motorization, also financing of road safety measures is easier as well as financing the infrastructure development projects.
All the selected countries are relatively highly urbanised. When divid-ing the fatality data by the location, we get results as follows:
Table 3. Fatalities Location, 1999
|
Location |
EST |
FIN |
CZE |
HUN |
USA |
RUS |
|
Urban areas |
54 |
102 |
584 |
572 |
15,894 |
15,517 |
|
Rural roads |
178 |
329 |
871 |
734 |
26,180 |
14,201 |
|
Total |
232 |
431 |
1455 |
1306 |
41,611 |
29,718 |
|
%, Urban areas |
23.3 |
23.7 |
40.1 |
43.8 |
38.2 |
52.2 |
|
%, Pedestrians killed in urban areas |
13.8 |
7.0 |
14.4 |
19.2 |
8.1 |
29.6 |
|
Population in urban areas, % |
69 |
81 |
78 |
64 |
76 |
73 |
The share of urban fatalities and pedestrian deaths in Russian Federation is remarkably higher, probably because of speed limit of 60 kph in urban areas, when all other selected countries have introduced the speed limit of 50 kph.
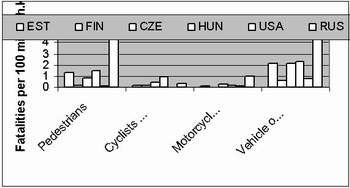
Figure 2. Number of Fatalities by Road User Groups per 100 Million Vehicle Km
The pedestrian indices are significant in all post-socialist countries. The pedestrian behaviour in these countries is very risky both on urban and rural roads. Drunken walking, red light infringement, road crossing in prohibited locations, walking on right side shoulder, insufficient use of reflectors, and other risky behaviour is very common.
The fatality travel rates of vehicle occupants (drivers and passengers) is also bad, when comparing the data of post-socialist countries with Finland and USA., but the difference is less than of pedestrians. There are fatality data of collision types in table 4.
Table 4.Share of Fatalities by Collision Types, %
|
Collision type |
EST |
FIN |
CZE |
HUN |
USA |
RUS |
|
Pedestrian accident |
35.3 |
15.6 |
22.9 |
30.3 |
11.9 |
41.4 |
|
Single vehicle accident |
36.2 |
30.6 |
34.2 |
13.3 |
42.1 |
23.5 |
|
Collision between motor vehicles |
28.5 |
58.8 |
42.9 |
56.4 |
46.0 |
35.1 |
The most common accident type in Russian Federation is pedestrian accidents, in Estonia- single vehicle accident, in other countries- accident be-tween motor vehicles. The differences between collision types differ essen-tially among the countries.
Drinking and driving is one of the most problems involved in road accidents in all countries, where the alcohol consumption is legal. In selected countries the following blood alcohol concentration levels (grams per litre or per mill) are introduced: Estonia 0.2, Finland 0.5 (but the discussion is going on to introduce the 0.2 level), Czech Republic, Hungary and Russian Federa-tion 0.5. In the USA there are introduced 0.8 level in 19 states and 1.0 level in 31 states, when 0.2 level is the limit for drivers under 21 years in all 50 states.
In spite of this, drinking and driving is still remaining to be very seri-ous problem in all countries, playing a part of 26% of fatal accidents in Estonia and Finland, 11% in Czech Republic, 10% in Hungary, 38% in USA and 20% in Russian Federation.
The most effective countermeasures against drinking and driving are total enforcement and drivers' testing with BRT in parallel with forced pun-ishments. The alcoholic beverage sale time limitations can also reduce the share of road accidents under the influence of alcohol.
Table 5.Use of Seat Belt
|
Position |
Estonia, 1999 |
Finland,1998 |
Czech Republic,2000 |
USA, 1999 |
|||
|
Urban |
Rural |
Urban |
Rural |
Motorway |
|
||
|
Front seat |
65 |
84 |
93 |
48 |
61 |
81 |
… |
|
Rear seat |
11 |
72 |
72 |
13 |
16 |
23 |
… |
|
Total |
… |
… |
… |
… |
… |
… |
67 |
The Czech and the Finnish results show that on the roads with higher speed limits people tend to use seat belts more frequently.
The use of seat belts can reduce the fatality risk about 40 %. If the seat belt usage in Estonia will reach up the level of some 90 % (as in Nordic coun-tries), the number of fatalities could be reduced annually by 0,4* (90%- 40%) = 20%.
The progress and experience of the high-developed countries could be set as an example for the post-socialist countries. The analyse shows that the differences will decrease parallel with harmonization between countries in motorization level, but it takes time.
The main problems of road safety in selected countries are:
Post-socialist countries must reduce the number of traffic fatalities and severe injuries. In the first stage the increase of using passive safety equipment in parallel with speed control (50 kph for urban streets) should be put on the first priority. The costs of these measures are minor;
Change of road users (especially pedestrians) attitudes towards the road safety should be developed;
Meaningful sanctions against some drivers (especially novice drivers) playing the main role in unsafe (speeding, drinking and driving, lack of skills) must be used;
Wrong attitudes of the society in general towards the road safety must be considered as a national health problem.
From a comparison of the (vehicle based) fatality rates of the selected countries it is clear that the fatality rates in post-socialist countries are much higher than in the high-developed countries.
The socio-economic data shows the development and car using condi-tions in post-socialist countries are in much lower level than in high-developed countries.
The relationship between fatalities per 10 000 motor vehicles and mo-torization level is valid for all selected countries and rapid changes are difficult to forecast.
References
1.United Nations Economic Commission for Europe. Statistics of Road Traffic Accidents in Europe and North America 2001. Geneva, 2001.
2.Pihlak, I., Antov, D. Road Safety Differences in the Baltic-Nordic Region. Proceedings of the 11th International Conference: Road Safety on Three Continents. Pretoria, 2000.
3.Pihlak, I.; Antov, D. Traffic Safety Comparison of Some Post-Socialist and High-Developed Countries. Proceedings of the 12th International Conference: Traffic Safety on Three Continents. Moscow, 2001.